
NAMMM
Structure of the information content from NAMMM
The list of available information from NAMMM is as follows:
- 1 minute count rates (easily can be changed to 10 seconds, or to another time span) of all 12 channels of NAMMM;
- Count rates of different incident directions separately, 36 possible coincidences of 6 upper and 6 bottom scintillators are related to 15 different directions;
- Count rates of the special coincidences;
- 1 minute estimates of the variances of count rates of each NAMMM channel, variances are calculated by 12 five-second count rates;
- 12 x 12 correlation matrix of NAMMM channels calculated by five-second count rates in 1 minute;
The raw data of the two sections of NAMMMs in the XML and csv formats available from CRD ADAS File server.
http://192.168.24.118/index.php?page=data.php
In the directory “DEFAULT” of both mentioned links the following information is stored correspondingly for the first and second sections of detector, namely NAMMM1 and NAMMM2:
- columns 1-12 - the count rates of all channels of NAMMM: first 6 columns – from upper layer scintillators, 7-12 columns – from lower layer scintillator. The count rates are posted in the Table 7;
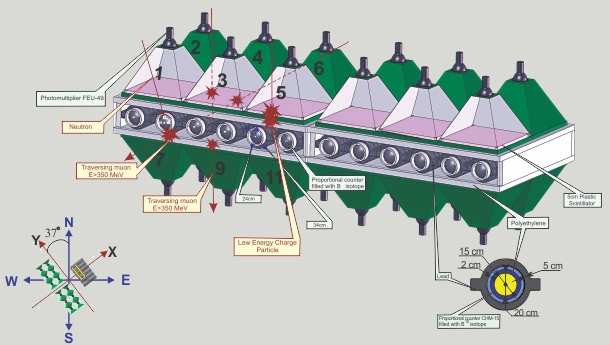
- columns 13-48 – the count rates corresponding to the 36 coincidences in upper and lower NAMMM layers, i.e. – corresponding to the traversal of the single charged particle (mostly muons with energy > 250 MeV). The order of the different directions in the file is following: [1-7] [1-8] [1-9] [1-10] [1-11] [1-12] [2-7] [2-8] [2-9] [2-10] [2-11] [2-12] [3-7] [3-8] [3-9] [3-10] [3-11] [3-12] [4-7] [4-8] [4-9] [4-10] [4-11] [4-12] [5-7] [5-8] [5-9] [5-10] [5-11] [5-12] [6-7] [6-8] [6-9] [6-10] [6-11] [6-12], where the first number corresponds to the upper layer and the second – to the lower. Also on the same Figure you can see the orientation of NAMMM axes according to direction to the North Pole, thus we can calculate the interval of the horizontal angles of incidence related to each coincidence.
- columns 49-55 – the count rates of the “special” coincidences different from listed above and forming the “full system” of possible configurations of the channel operation. Conditioned on the existing as minimum 1 signal in 12 NAMMM channels there could be the following possibilities of number of counts in top and bottom layers (the first sign in the pair is corresponding to the upper scintillator): many-many (more than one count in 4 top and 4 bottom layers), many-zero (more than 1 in top and nothing in 4 bottom), zero-many, zero-one, one-zero, many-one, one-many. The fraction of the “special” coincidences relative to the “main” trigger is posted in the Table 11.
- columns 56 - the number of the “main” triggers – at least one signal in 12 channels in preselected time span (1 minute). If we consider all logical configurations of NAMM operation outcomes, this number will be equal to sum of the columns 13-55.
- columns 57-68 - the variances of 12 channels,
- columns 69-134 – the correlation matrix,
In the directories “spectrum” the 127-channel histograms of the energy releases are stored for each minute, in files with extensions:
- spectrum1 - spectrum6, the histograms of the energy releases in the upper scintillators are stored.
- spectrum7 - spectrum12, the histograms of the energy releases in the lower scintillators are stored;
- spectrum13 - spectrum18, histograms of energy releases, in upper detectors are stored with condition that in lower detectors there was now signal, i.e., the energy releases of electrons and low energy muons filtered in the lead absorber.
The information on the spectra of energy releases is essential for the continuous calibration of the all measuring channels. As one can see in the maximum of smoothed histograms are in the region 10-11 MeV, and this value should be monitored and kept constant during multiyear detector operation. In Figure 8 are presented 1-minute spectra summed over all four detectors and averaged over several hours. The blue curve is energy releases of the low energy muons and electrons (spectrum13-18) and the red curve is corresponding to high energy muons (subtracting from spectrum 1-6, spectrums 13-18). We can see than high energy muons in average can give much higher energy releases comparing with low energy muons and electrons. This additional information can be useful if Ground Level Enhancements (GLE) was originated by the primary particles having higher energy comparing with the GCR flux. Additionally to enhancement of the count rate we may notice some unusual features in the histograms of energy releases.